Index >> Development >> Components & Libraries >> Nevron Chart for .NET
Report SpywareNevron Chart for .NET 2016.1
Software Description:
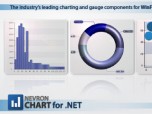
Nevron Chart for .NET - Professional Chart component for WinForms and ASP.NET applications.
Nevron Chart for .NET is designed to be flexible, efficient and extensible. Combining a vast amount of features in an intuitive and straightforward programming model, the component can display virtually any 2D or 3D chart including: Bar, Line, Step Line, Area, Pie, Point, Bubble, Stock, Floating Bar, Radar, Polar, High Low, Mesh Surface, Grid Surface, Shape, Smooth Line, Float Bar, Venn and Error with many variations (such as Scatter XY and XYZ Line, Stacked Bars, etc.). Other charting features include scrollable axes, integrated legend, chart annotations, watermarks and very extensible chart layout manager. The component also features full AJAX support and Visual Studio design time support with many advanced features such as style editors, allowing you to quickly modify the chart through the visual interface only. The control includes as well and a custom toolbar plus an integrated data grid components, which can come handy in advanced charting applications requiring high degrees of interactivity features.
What's New: New Features, New Chart Series, Improved Performance, Bug fixes
Limitations: 60 Days Trial; 60 days fully functional evaluation
Feature List:
- Charting Types: Bar; Line; Area; Pie; Point; Bubble; Stock; Floating Bar; Radar; Polar; High Low; Mesh Surface; Grid Surface; Shape; Smooth Line (Spline); Float bar (also called Gantt); Venn - 2, 3, 4, 5 etc. Venn set; Step Line; Error Bar
- Flexible integrated legend
- Built in Functions and Formula support
- Full Visual Studio design time support
- Editors available at runtime
- Excel like fill effect editors
- Advanced control over the axis scaling and position
- Axis labeling abilities
- Ability to display several charting types simultaneously
- Ability to display several series simultaneously
- Ability to display multiple charts and legends in the component canvas
- Image borders
- Watermarks
- Labels
- Interactivity
- Drill Down capabilities
- Advanced 3D view control
- Advanced control over the scene lighting
- Integrated layout manager
- Measurement Unit support
- Annotation support
- Advanced logic features and services
- Modular design
- SVG support
- Editor direct update feature
- Nevron DOM Compatible
- AutoRefresh property
- Custom Binary and Custom XML serialization
- Rendering of chart walls
- Windows Forms specific features
- Built in UI components
- Ability to leverage the video board hardware acceleration
- Print Manager
- Web Forms specific features
- Server side events (postback) and HTML image maps
- Server side persistency
- Ability to inject custom client side script
- Ability to directly stream an image to the client browser
- Built-in temporary file clean up
- Built-in browser detection
100% Clean:
 Nevron Chart for .NET 2016.1 is 100% clean
This download (DotNetVisionChart.zip) was tested thoroughly and was found 100% clean. Click "Report Spyware" link on the top if you found this software contains any form of malware, including but not limited to: spyware, viruses, trojans and backdoors.
Related Software:
- Nevron Vision for .NET 2016.1 - Professional Chart and Diagram suite for .NET applications.
- Nevron Diagram for .NET 2016.1 - Professional Diagram component for .NET applications.
- Nevron SSRS Vision 2012.1 - Professional Data Visualization Component Suite for SSRS. Chart, Gauge.
- Nevron Gauge for SSRS 2016.1 - Professional Gauge component for SQL Server Reporting Services
- Nevron Chart for SSRS 2016.1 - Professional Chart component for SQL Server Reporting Services
- Nevron SharePoint Vision 2012.1 - Professional SharePoint Data Visualization suite. Chart, Gauge.
- Nevron Gauge for SharePoint 2015.1 - Professional Gauge component for SharePoint Server
- Neat Wizards 1.1.100 - High-quality images for creating professional user wizards and dialog boxes.
- SharpShooter Collection 6.4 - Data processing, analysis and visualization components for .NET in one package.
- EaseSoft PDF417 Barcode .NET Control 3.5.0 - EaseSoft PDF417 Barcode .Net Control support printing and images output
top 10 most downloaded
recommended software
-
- HelpSmith
- HelpSmith is an innovative help authoring tool which allows you to create CHM Help files, Web Help , Word RTF, and Manuals from a single source. The r...

-
- EditPlus
- EditPlus is a text editor, HTML editor, PHP editor and Java editor for Windows. While it can serve as a good Notepad replacement, it also offers many ...


