Index >> Development >> Debugging >> WinGDB
Report SpywareWinGDB 2.3
Software Description:
WinGDB - Visual Studio extension for mobile, local/embedded or remote debugging using GDB
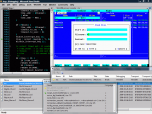
WinGDB is an extension for Visual Studio IDE allowing to debug mobile/Android applications, processes on remote machines running Linux (or other Unix systems), embedded targets or local machines (built with use of Cygwin/MinGW tools), using native Visual Studio debugging user interface.
Features
An Add-In for the Visual Studio IDE providing integration with the VS debugger interface.
Android SDK/NDK debugging on emulator and devices.
Remote Linux debugging through SSH connection.
Indirect Linux debugging through SSH connection with gdbserver.
MinGW and Cygwin local debugging.
Embedded Linux systems and OpenOCD/JTAG debugging.
Palm webOS debugging.
Java debugging for Android applications.
Seamless integration with standard Visual Studio projects.
The "Attach to process" dialog extension allowing attaching to remote processes.
The "Launch process" command, allowing to launch remote processes inside GDB.
The "Examine core dump" command, allowing to examine core dump inside GDB.
Remote build - run makefile (it may be any command) on remote machine. The output of compiler/linker dumps to VisualStudio Console/Task-Window.
Integrated remote terminal.
Initialization scripts.
Visualizers (aka "pretty printers" or "auto expanders").
Remote source code browsing in the Visual Studio editor. The files are fetched as needed using SCP protocol and cached over a session.
Remote edition of the source code in the Visual Studio editor.
Basic debugger commands: Run, Step over/into/out, Break All, Continue, Run to cursor, Set Next Statement.
Breakpoint setting in remote source files browsed locally.
Breakpoint setting by function name or through call-stack window.
Additional breakpoint properties: conditions, hit counting, temporary disabling.
Data breakpoints.
Call stack window.
Watch window.
Auto / Locals window.
Processes / Threads window.
Modules / Memory / Registers window.
Signals window.
Disassembler view.
Console window for debugged process I/O, emulating a XTerm terminal.
What's New: Debugging multiple processes. Integrated SSH terminal window. Process console improvements. GDB versions: up to 7.5. Visual Studio 2012 support.
Limitations: 30 Days Trial
Feature List:
- Features An Add-In for the Visual Studio IDE providing integration with the VS debugger interface
- Remote connection to target machine over SSH
- Support for the GDB debugger as a backend
- 'Attach to process' dialog extension allowing attaching to remote processes with GDB. The process can be selected using the standard VS process list
- 'Launch process' command, allowing launching remote processes inside GDB. The program to debug can be selected using a remote file system browser. Also the working directory, arguments and additional environment variables can be specified
- Remote source code browsing in Visual Studio editor. The files are fetched as needed using SCP protocol and cached over a session
- Remote edition of the source code in Visual Studio editor. Edited file is automatically sent back to the target machine after saving it
- Basic debugger commands: Run, Step over/into/out, Break All, Continue
- Breakpoint setting both in remote source files browsed locally, as well as in their local copies (e.g. from currently loaded project)
- Additional breakpoint properties: conditions, hit counting, temporary disabling
- Data breakpoints
- Call stack window
- Watch window
- Auto / Locals window
- Processes window
- Modules window
- Threads window
- Memory window
- Registers window
- Signals window
- Disassembler view
- Console window for debugged process I/O, emulating a XTerm terminal
- Generating core dump
- Follow fork mode for debugging daemons
100% Clean:
 WinGDB 2.3 is 100% clean
This download (WinGDB-latest_trial.msi) was tested thoroughly and was found 100% clean. Click "Report Spyware" link on the top if you found this software contains any form of malware, including but not limited to: spyware, viruses, trojans and backdoors.
Related Software:
- Bug Tracking/Defect Tracking Single User License 2.9.8 - Manage software development projects by tracking bugs/issues with problem report
- Bug Tracking/Defect Tracking 5 User 2.9.8 - Manage software development projects by tracking bugs/issues with problem report
- Bug Tracking/Defect Tracking 10 User License 2.9.8 - Manage software development projects by tracking bugs/issues with problem report
- Bug Tracking/Defect Tracking Unlimited User Licens 2.9.8 - Manage software development projects by tracking bugs/issues with problem report
- Bug Tracker Deluxe 4.2 - Bug management software for software developers.
- TCP COM Bridge 1.5.4.701 - TCP COM Bridge - connects real or virtual COM ports over Ethernet or Internet.
- Eltima Serial Port Monitor 1.2 - Serial Port Monitor for professional RS232/422/485 COM ports monitoring.
- Advanced Serial Port Monitor 4.3.9.828 - Monitor data received from and sent to a COM port in manual, auto or spy modes!
- EasyBugNets 1.11c - EasyBugNets is a free automatic bug reporting package for Delphi applications
- RapidDriver 2.1.5.1 - Toolkit for USB/PCI/ISA Hardware Programming and Debugging.
top 10 most downloaded
recommended software
-
- HelpSmith
- HelpSmith is an innovative help authoring tool which allows you to create CHM Help files, Web Help , Word RTF, and Manuals from a single source. The r...

-
- EditPlus
- EditPlus is a text editor, HTML editor, PHP editor and Java editor for Windows. While it can serve as a good Notepad replacement, it also offers many ...


